System tuning under RSX-11M PLUS can mean many things. At Amway Corporation it means minimizing terminal response time while maximizing thruput of the machine. Before going into how we meet these often conflicting goals, let me tell you a little about the environment.
Amway's world headquarters (and main manufacturing facility) employs about 3500 individuals in a complex of connected buildings over a mile long. Our computer center is near the middle and houses a large IBM shop (3081 and 3033 processors) in the "big computer room". In the "small computer room" we have one PDP-11/70 and other equipemnt such as an IBM System 38. The PDP-11/70 is configured with three Megabytes of memory, a RM05 system disk, 3 RA81 user disks, and two tape drives (TU77 and TE16). The machine has 3 DL single line terminal interfaces, a sixteen line DH, and enough DZ's to bring the total to TT102:. Two DUP-11 interfaces provide bisync connections to the IBM network for both RJE and 3270 terminal emulation. We dream of it being an 11/74.
We use the DEC processor as an in-house timeshare service. It is used primarily by the Research and Development and Quality Assurance areas. Because it is a timeshare system, we have very little control over the processing load the users place upon it. To try to make sense of the load, we have defined several classes of users and support.
First are the production applications that have been justified, documented, formally reviewed, and approved. They have an elevated priority on the machine. Word Processing of all of the control documents used in our manufacturing processes is one such production application and often there are 8 WP users active (and half of them are list processing). We use WORD-11 for our production word processing. However, since this is primarily a timeshare system, production applications are usually implemented on the IBM systems (for example, a daily set of approved new or updated documents is transferred from the DEC to the IBM for recall by the users; only the document maintenance is done on the DEC). Production applications are those that cover more than one department (or use software purchased from a vendor). Production applications often have their own group, so a user may have several accounts (one for general departmental use, and one or more cross departmental application accounts). Production accounts are backed up more often than the other types of accounts on the system.
The next class is the departmental user (each department is a seperate group on the system). They write and use their own applications. Many tools are available for this such as BASIC (BASIC-11 and BASIC PLUS 2), FORTRAN-77, MACRO-11, and Datatrieve. A wide variety of editors is also available (EDT versions 2 and 3, EDI, KED), and we also offer FMS-11 to ease screen handling. These users all run at the default system priority (with the editors slightly elevated to improve response time). We run a lot of statistics programs (We support SPSS and users also write their own for specialized problems), and we support a spreadsheet package. None of the users are privledged.
Both of these user classes can receive support for any documented program they wrote or for any supported system component by calling our HELP Desk (a phone call to one number resolves hardware problems, report distribution problems, or any other problem/question dealing with data processing). The HELP Desk functions as a mini support center, logs the call, and assigns it to the proper person for resolution. Management receives daily status reports on all problems and it has turned out to be very convenient for all users (both IBM and DEC users). If the support personnel (currently two individuals in the EDP Technical Support Department) cannot resolve a problem they in turn take it to DEC (or the appropriate vendor). We run on the theory that supported software is documented; so if reality and the documentation disagree, one of them needs adjusting. If the software came from a vendor, we report it and let the vendor make the adjustment (try to follow the vendors rules when you do this, they usually know what information they need to correct your problem and they tell you how to report it; if that fails, try other methods if you still have a problem). Remember, if the vendor doesn't know about it, they can't fix it, and you have to live with it.
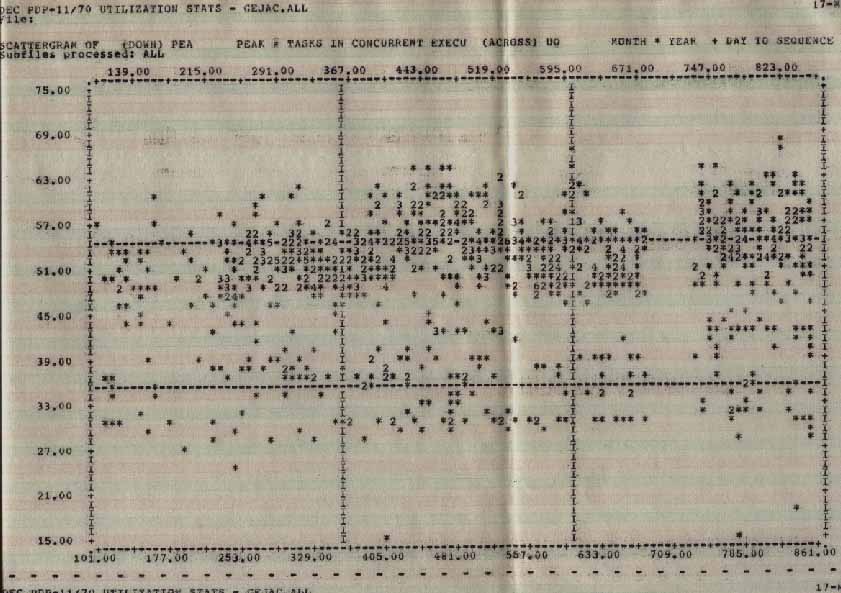
The third class is unsupported software ('mirror image' software; that is, if you want to see who supports it, look at the image in the nearest mirror). This consists mostly of DECUS software and includes packages such as TECO, the SOS editor, PASCAL, C, FORTH, and many utilities. These all run at a priority below the default so they don't crowd out supported software. An average load during our prime shift (8 am to 5 pm on working days) is 49 active tasks (see graph of peak task load vs date).
The final class is BATCH users in the batch processor. No matter what they are running, if its at a priority above 48 (remember, the default is 50), it is reduced to priority 25. Batch users take whatever time the terminal users aren't using to minimize the impact on terminal response time. This is done with a in-house developed monitor (available from the DECUS library - look for Decus Program # 11-792, March 1985) known as ZZZ. We normally have three batch processors available.
We have over 300 users defined to the system, and over 200 of them use the system in any given month, and most of those use it daily. However, we have modified HELLO to limit the number of concurrent logged on users to 20 (plus the batch processors) at any given time. Override accounts that allow logons when the system is at max users are available. This occasionally causes problems at peak times, but it has been a workable solution to insuring relatively good response time once you get logged on. This max users value was developed from experience.
There are many approaches to system tuning. We base ours upon the theory that there are so many clock cycles available in a day (and we have days where we use them all). These can be divided into null time (i.e., the processor is in a wait state), user work (user state in a user application or utility), system work (system state performing a specific request for a user such as retreiving a record from disk and putting it into a users buffer), and system overhead (system state activities that do not do productive work but are necessary to maintain a productive environment).
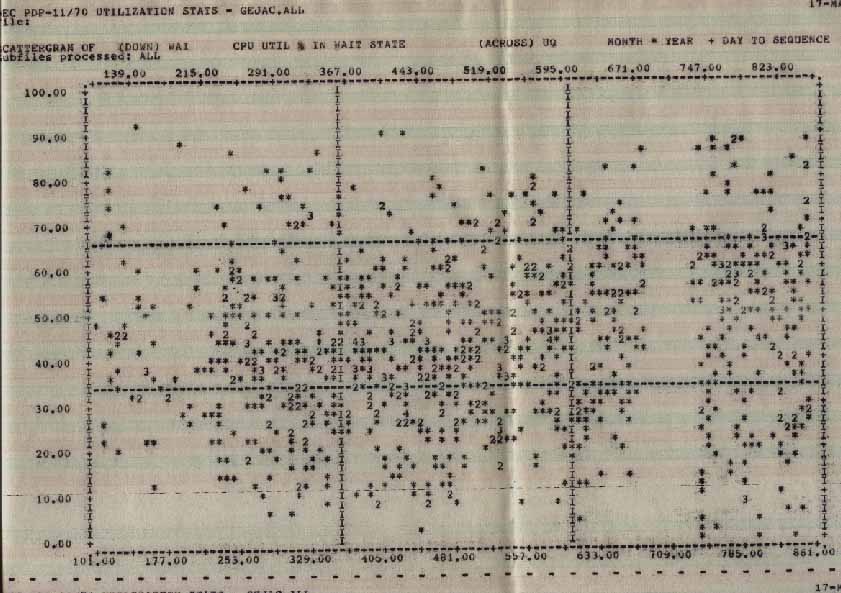
Null time (see graph of processor wait time vs date) is something you never want to run out of, because if you do, everything slows down. The solution is to either add more processing power or reduce some other component of the total time being used. System overhead is the logical choice because user work is what we are trying to maximize.
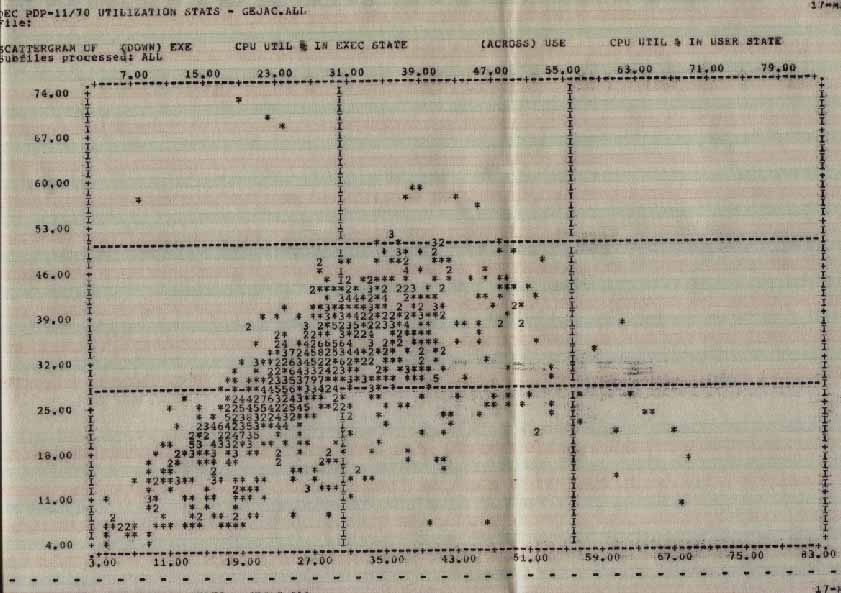
Isolating system overhead from system work is not easy. The best solution we have found is to monitor the ratio of user to system state (see graph of user vs system state). If the ratio increases (that is, more user than system state) after a tuning change, we reduced system overhead. If it decreases, we increased it. Because our system is operated 24 hours a day, seven days a week, we must usually determine this statistically instead of by running benchmarks.
One of the worst causes of system overhead is the shuffler. When a memory allocation request fails, the shuffler is invoked to rearrange the tasks in memory to make it possible for the failing request to succeed. Fixing tasks in memory can cause fragmentation leading to the shuffler being invoked. If you must fix tasks, install them during startup so they are on the edge of the GEN partition, or make a seperate partition to put them in. Adding memory to your system is another, more expensive, solution to this problem.
Another cause of system overhead is a checkpoint. This occurs when a task is temporarily inactive (waiting its turn to execute) and has the effect of copying the task to disk (and later restoring it to memory). No productive work is done during this period. The shuffler uses checkpointing to move tasks around in memory. Another cause of checkpointing is tasks extending themselves and colliding with another task loaded above it in memory. The task is checkpointed and restored to a new location that will allow the extension to occur. If you expect a task to extend itself, install it with an appropriate increment to prevent the collision and checkpoint from occurring. The taskbuilder is a good example of a task that has this attribute.
We find that the file system has overhead that can be reduced. First, mount each disk with a seperate ACP (MOUnt with the switch /ACP=UNIQUE) to maximize the amount of buffer space available for each disk. Second, expand the number of control blocks and buffers in memory by increasing the LRU and WIN counts above the defaults (especially useful on big disks with many of accounts). Finally, look at the ACP's taskbuild command file in [1,20] and see about enlarging the buffer area following the comments. The ACP goes to primary POOL when it runs out of space internally, so you want to put as much buffer space in the ACP as possible.
Another tuning step is to spread the I/O across all of the devices on the system. Checkpoint files are used in the order allocated, and checkpoints take I/O. Allocate your checkpoint space starting with your least used disk (consider reallocating the checkpoint space on the system disk to put it into a less used position to improve task loading by reducing the I/O load on the system disk-just make sure you keep one checkpoint space alocated while you reallocate the system disk). Another tip is to use a logical assignment for each group in the account file and actually make the logical assignments globally at startup. This will allow you to move a group transparently at any time to balance I/O.
Another approach is to reduce user work and system work in the applications. Preallocate files to prevent the overhead of a file extension while the task is executing. Make sure you use effecient bucket sizes. Use common sense when designing the application. Indexed files will need to be reorganized periodically, as will entire disk volumes. There are often two ways to ask the system to do something; make sure you are using the more effecient way in your applications.
Terminal I./O should also be considered. A DH uses DMA output when possible, reducing the number of interrupts that must be serviced. Put your heaviest activity terminals on your DH controller if you have one. If not, put them on the first couple lines of each DZ. Consider standardizing terminal speeds to reduce the bursts of interrupts that make for uneven response time when high speeds are used. We have standardized on 4800 baud for production and 2400 for non-production terminals. Users are free to change this, but they must do so every time the system is booted.
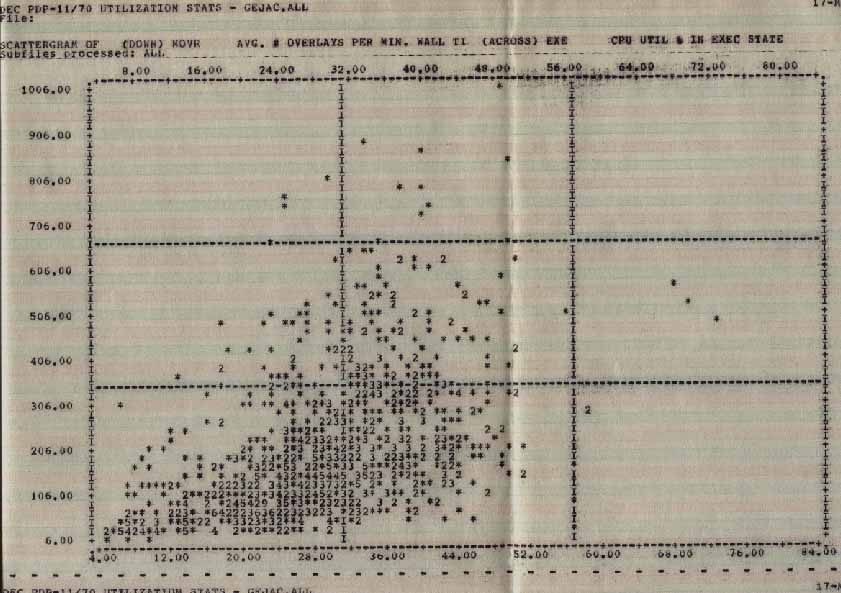
Another source of overhead is task loads and overlay loads (see graph of overlay rate vs system state). If a task will be used by several users, consider making it a multiuser task with shared code that only needs to be loaded once. Strive to reduce the number of overlays. We do not have users on the system disk (only support individuals) and all software is loaded from there for production applications. This also includes the use of resident libraries to further reduce the size of the code needed to be loaded when the application is run. We load all non-RSX tasks from [4,54] so the tasks are located near the RSX tasks physically on the disk to reduce head movement.
Another source of overhead is intertask communication. Some of it is intentional, such as send data directives. There is often nothing you can do about it, but keep it in mind as a source of overhead. Some may be unintentional, such as offspring control blocks. These are created when a task is started, and released when the task exits or emits status. They occupy POOL space, often causing fragmentation (that can be another source of overhead). If you don't need the offspring control block to hang around, you might consider emitting status to make it go away. This control block does not go away when the parent task exits (the ZZZ Monitor cleans up some of these).
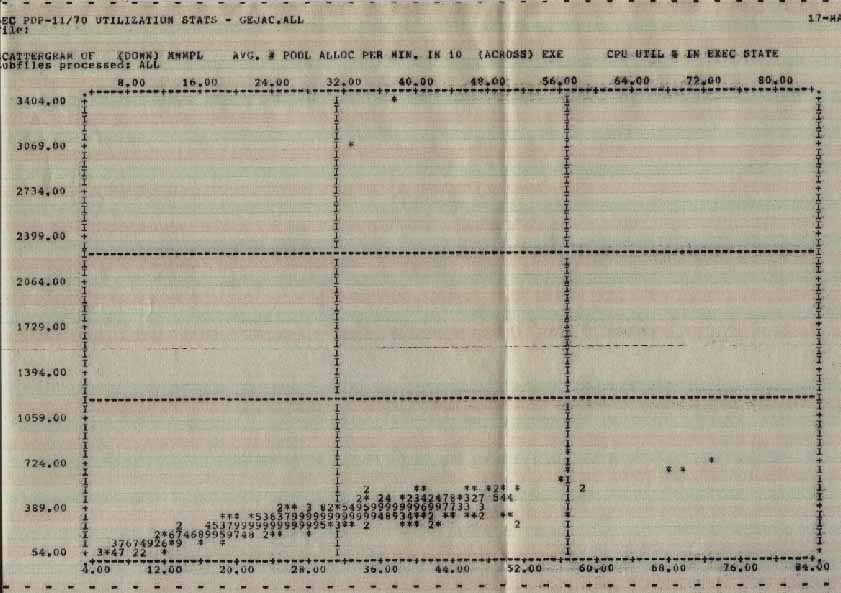
POOL is another source of overhead (see graph of POOL allocation rate vs system state). If it becomes fragmented the system must do more work searching for a fragment large enough to service the request. POOL is a limited resource, even under M Plus with its secondary pool. Long running tasks (batch processors, spoolers, etc.) must be started before there is much system activity so their control blocks will sit on the edge of POOL to prevent fragmentation. Disable logons while booting, enabling them only after the system is ready.
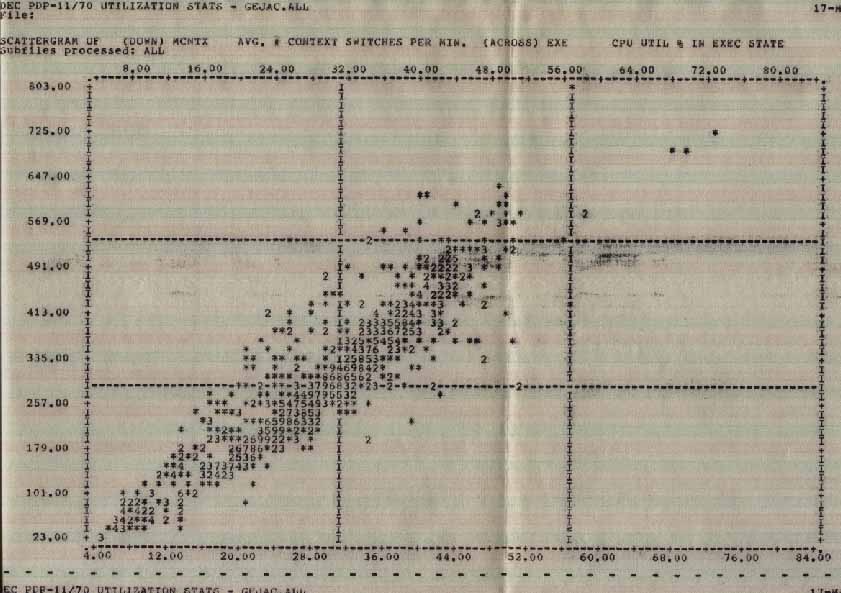
The round-robin scheduling routines are another source of overhead because of context switching (see graph of context switch rate vs system state). Don't be afraid to change the interval to a longer time. Use the priority scheme instead. A useful technique for doing this is to compile a list of all of the tasks to be run in the system. Rank the list in priority order by asking the question "If I could only run one task, what task is that?". Move that task to a second list, and repeat the process until all of the tasks have been ranked. Don't forget to include the default priority. It is strongly recommended that system tasks keep their relative position in the list. Now go thru the ranked list and assign priorities (working up and down from the default) so that tasks are evenly spaced. You now need to see if any tasks are inherently CPU bound (like the task builder) and consider reducing their priority slightly to minimize the impact on terminal users (we run TKB at 48.) Its ok if some tasks have the same priority, just don't make the number of equal tasks too large. Now go back and re-VMR your system.
Finally, look for bottlenecks in system performance. Do your disks spend all day hopping around the computer room? Consider turning on disk optimization to reduce head movement, and play with the values until it gets better. Your overlay rate goes up, is it one task being run by everyone thats causing it? See if the task can be flattened, or maybe broken into two tasks with different functions. This implies good records of system activity for analysis and review. Use RMD and the system accounting files (converted to Datatrieve for easy manipulation), or use a system monitor (SPM-11 from DEC and SRF from GEJAC are two examples). Feed your raw data to a statistical package.
System tuning is an ongoing affair. System conditions evolve and the tuning must continue in order to match the changing demands on the system. Keep a record of what changes were made when. Graph your data. Look for short and long term cycles. Look for trends. Slopes and curves that flatten out usually point out bottlenecks that can often be widened to allow more thruput. Develope a profile of the average task and see how it is increasing in sophistication by its growing demands for system resources.
RSX is a very robust operating system with lots of knobs that can be turned. The task of system tuning is learning how to turn those knobs to make the system hum your tune.
The RSX System Log, the RSX System Accounting information, and Monitoring Reports from our System Resource Facility (SRF) from Gegac, Inc. were parsed using an author written BP2 utility and fed into a Datatrieve file so they could be extracted for input to SPSS-11 to produce the graphs for this presentation. In normal use we would extract data from before and after a given tuning change to determine its impact. The database was populated overnight by batch jobs and current reports were available every morning for review.
CNTX across EXEC Statistics
Average Number of Context Switches per minute across CPU Utilization in Exec State.
EXECacrossUSER.jpg Statistics
CPU Utilization in Exec State across CPUĀUtilization in User State
OVLYacrossEXEC.jpg Statistics
Average Number of Overlays per Minute across CPUĀUtilization in Exec State
PEAKacrossTIME.jpg Statistics
Peak Number of Tasks in Execution across Date (Month*Year(YY)+Day)
POOLacrossEXEC.jpg Statistics
Average Number of Pool Allocations per Minute across CPUĀUtilization in Exec State
WAITacrossTIME.jpg Statistics
Wait State across Date (Month*Year(YY)+Day)